SNOWLUSH
ULTIMATE
trading
journal.
the SUPERPOWER you need!
In Short:
This is an innovative interactive trading journal designed to revolutionize the way you track, analyze, and improve your trades. Whether you’re a seasoned investor/trader or just starting out this journal provides the tools and insights you need to succeed. This DIY journal gives you a 360 degree view of your trading style, helps you rectify the mistakes and double-down on the winning strategies.

What Makes our Trading Journal Special?
Let’s Find Out!
| ✅ Demat Account Wise Profit and Loss Summary | ✅ Minimum-Maximum-Average Chart |
| ✅ Win-rate and Loss-Rate Summary | ✅ Monthly Profit/Loss Summary in bar chart |
| ✅ Monthly Profit/Loss Summary | ✅ Strike-Price wise Profit/Loss |
| ✅ Money Management to Profit/Loss Correlation | ✅ Running total of funds in all your accounts |
| ✅ Calls and Puts Summary | ✅ Built-in Risk:Reward Calculator |
| ✅ A cool Time-Range summary | ✅ Psychology to Profit/Loss Correlation |
| ✅ Funds added and Funds Withdrawn Summary | ✅ Trading System to Profit/Loss Summary |
| ✅ Strategy-wise Profit/Loss | ✅ Quarterly Profit/Loss in a bar graph |
| ✅ Journaling wise Profit/Loss Summary | ✅ And more! |
Our Introductory Launch Price:
(Valid only for a short period)
Rs.999/- 499/-
This Investment on your DISCIPLINE will be worth it!!

Why and how is it better than broker statements?
Here’s why..
Maintaining an Excel sheet trading journal has become one of our most valuable tools for growth as a trader, providing insights that broker reports alone simply can’t offer. Broker reports are limited —whereas an Excel journal gives us the freedom to document the complete picture of each trade (and visualizing it with charts and graphs), including the strategy, thought process, and even psychological factors influencing our decisions. We can categorize trades by specific setups, track our adherence to rules, and analyze performance metrics in a way that aligns with our unique goals. This level of customization has helped us pinpoint our strengths and weaknesses, allowing us to adjust and refine our approach over time. Reviewing our journal regularly not only deepens our understanding of our trading patterns but also instills discipline and accountability, key elements that have significantly accelerated our development as traders.

Here for the first time?
We get it, You have more questions! Keep scrolling..
PRODUCT FEATURES –
- Advanced Performance Analysis: Gain deeper insights into your trading performance with advanced analytics tools. Identify strengths and weaknesses in your strategy, track progress towards your trading goals, and make informed decisions for future trades.
- Interactive Charts and Visualizations: Visualize your trading data with interactive charts that allow you to analyse trends, identify patterns, and spot opportunities for optimization.
- Streamlined Trade Logging: Say goodbye to tedious manual tracking methods. With SNOWLUSH ULTIMATE TRADING JOURNAL, you can easily log your trades with detailed information including entry and exit points, trade duration, asset traded, and trading strategy employed.
- Risk Management Tools: Implement effective risk management strategies with features such as risk-reward ratio analysis, position sizing calculators, and trade outcome tracking.
- Intuitive Dashboard: Access a user-friendly dashboard that provides a snapshot of your trading performance, including key metrics such as profit/loss, win rate, and trading frequency.
- Journaling and Reflection: Encourage self-reflection and continuous improvement by journaling your thoughts, emotions, and observations before, during, and after each trade. Identify psychological biases and behavioural patterns that may influence your trading decisions.
- Comprehensive Performance Analysis: By consolidating your trading data, you gain a comprehensive view of your overall trading performance. Analyze your profitability, win rate, risk exposure, and other key metrics across all accounts to identify patterns and trends more effectively.
- Holistic Risk Management: Managing risk becomes much more efficient when you can assess your total exposure across all accounts at a glance. With a unified trading journal, you can easily monitor your overall risk profile and adjust your trading strategy accordingly to mitigate potential losses.
- Simplified Tax Reporting: Keeping track of trading activity for tax reporting purposes can be a headache, especially with multiple accounts. By centralizing your trading data, you simplify the tax reporting process and ensure accuracy when filing your taxes.
- Consistent Trading Strategy: Maintaining consistency in your trading strategy is essential for long-term success. With all your trading data in one place, you can more easily track the performance of your strategy across different accounts and make adjustments as needed to stay on course.
- Effortless Portfolio Management: Gain a clearer understanding of your overall investment portfolio by consolidating your trading activity. Easily track your asset allocation, diversification, and performance across all accounts to make more informed investment decisions.
- Improved Decision-Making: Access to a unified trading journal empowers you to make more informed trading decisions based on a comprehensive analysis of your entire trading history. Identify what’s working well and what needs improvement to refine your strategy and optimize your performance.
- Customization Options: Tailor SNOWLUSH ULTIMATE TRADING JOURNAL to suit your individual trading style and preferences. Customize dashboard layouts, set personalized trading goals. The template is created in light mode. But you like the darker side? Well, worry not. You can modify the charts to DARK MODE with just a few clicks.

Convinced Yet?
No? Okay! Enough said. Let’s directly see the magic in charts..
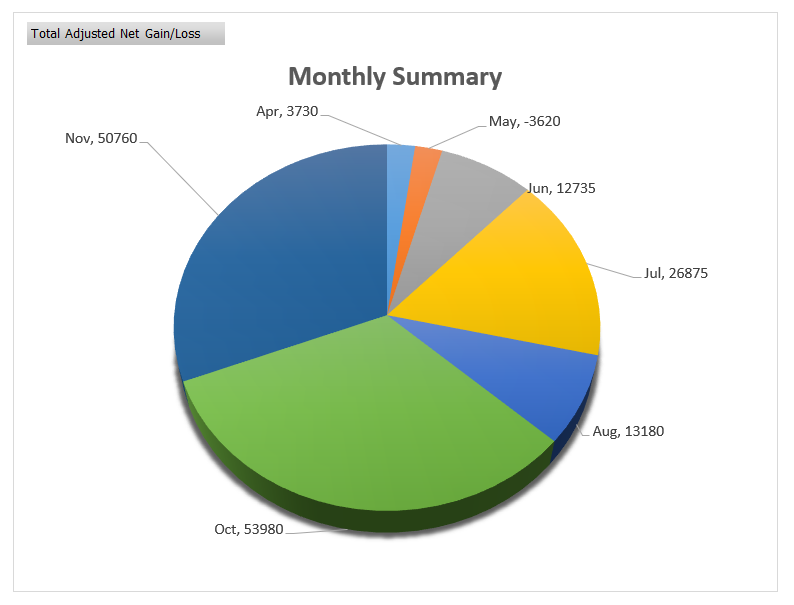
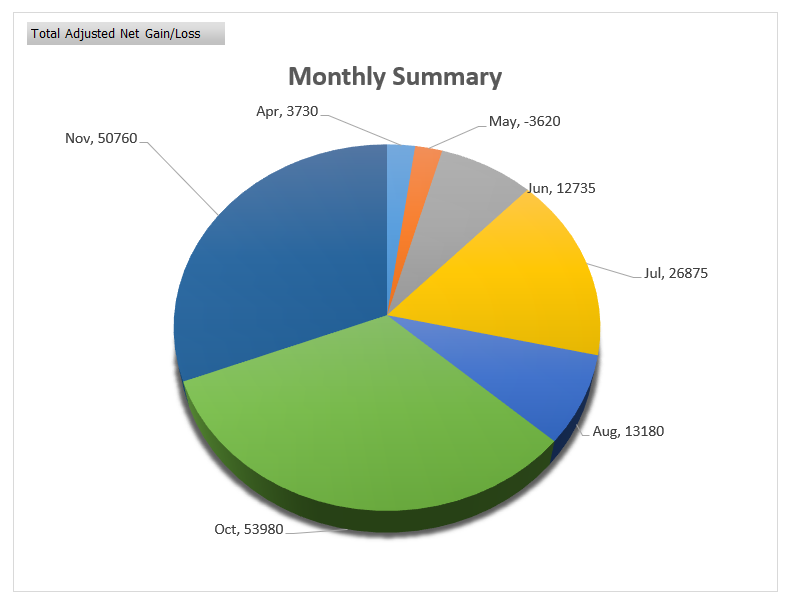
Monthly Profit/Loss snapshot
Here’s a pie-chart to get the bird’s eye-view of your monthly profit/loss summary.
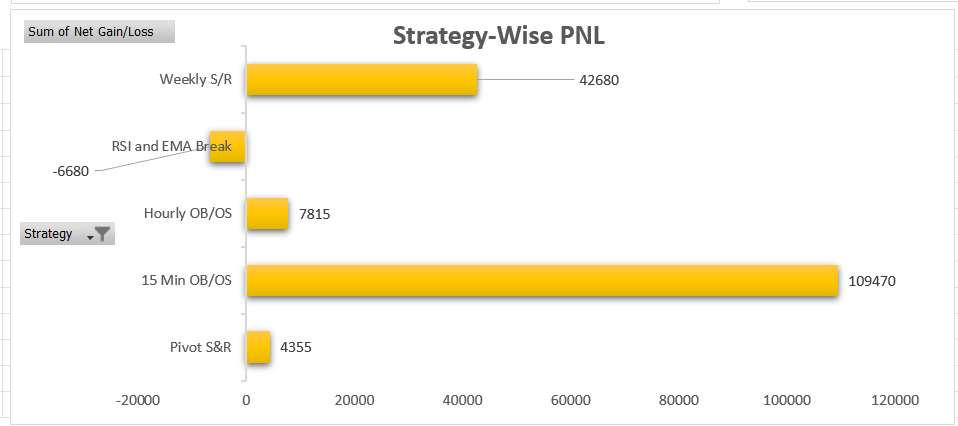
Strategy-wise Profit/Loss Summary
So you have certain set of strategy (or what we call edge) in the market. Which edge makes you the most amount of money and which doesn’t? Let’s find out through this chart.
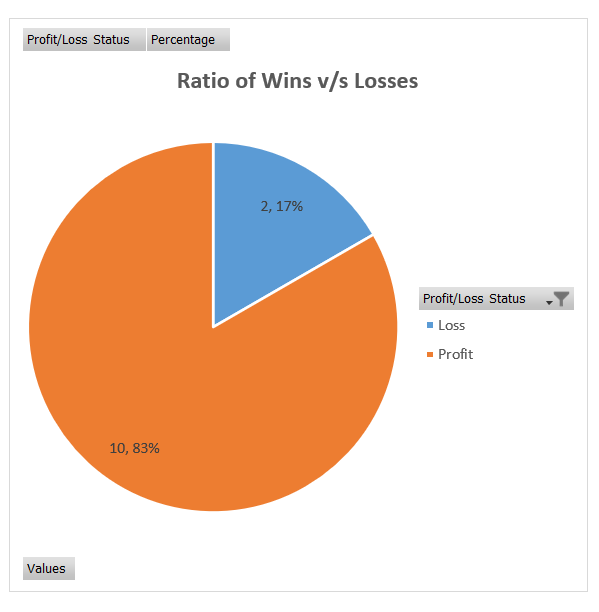
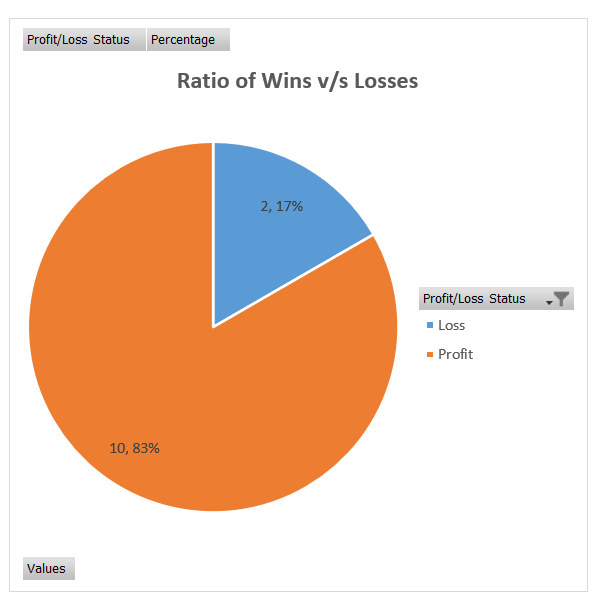
WINS/LOSSES SUMMARY
A Pie-chart showing your Win-rate and Loss-Rate, along with the number of trades you won/lost. Cool, isn’t it?

Longs and Shorts Summary
Does buying longs favour you or going short does? Check it out.
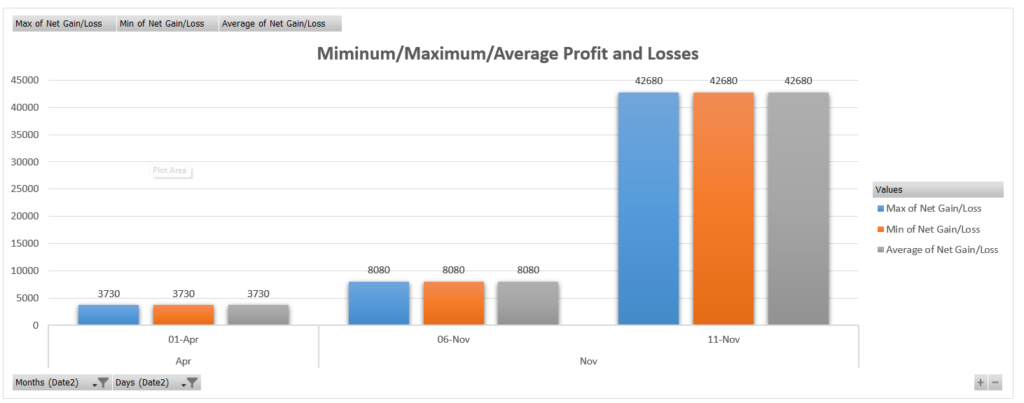
Minimum-Maximum-Average Chart
A bar graph showing you the average returns you make over a long period of time. The Max profit and max Loss incurred, etc

Running total of Funds
A Running total of all your account balances in one place to see the net status.
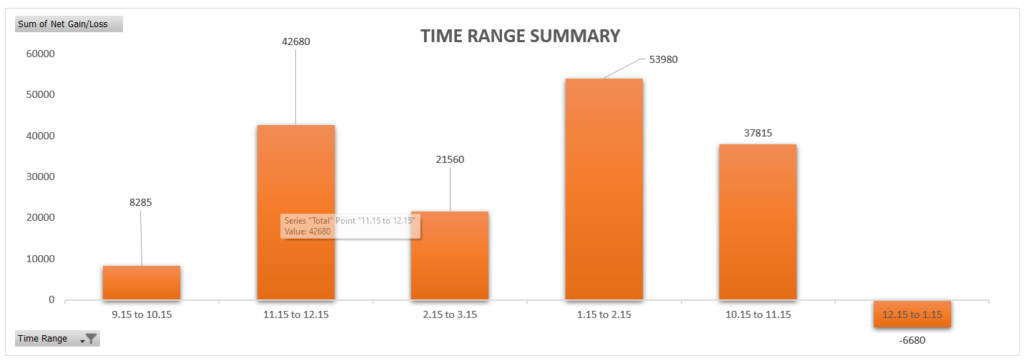
A cool Time-Range summary
Where you get to see which time of the day do you perform the best and uh oh! , the worst?
Just one more thing we thought you’d love to know before we dive deeper into the features is :

Your Contribution to a Greener Planet!
For every sale made, we will plant/donate one tree (Via Foundations) to reforestation efforts around the globe.
In addition to empowering you with advanced tools for trade tracking, analysis, and improvement, we are proud to announce our commitment to environmental sustainability. For every sale made, we will plant/donate one tree (Via Foundations) to reforestation efforts around the globe.
With each purchase of SNOWLUSH ULTIMATE TRADING JOURNAL, you’re not only investing in your trading success but also in the future of our planet. Together, we can make a significant difference by replenishing forests, preserving biodiversity, and combating climate change.
This is our mission to trade smarter and greener!
Alright! Now back to the journal…

And you thought, what else there is to track anyway?
Well, there is! And that’s how you evolve into a disciplined Trader/Investor and eventually become a PRO. Okay, Let’s find out..
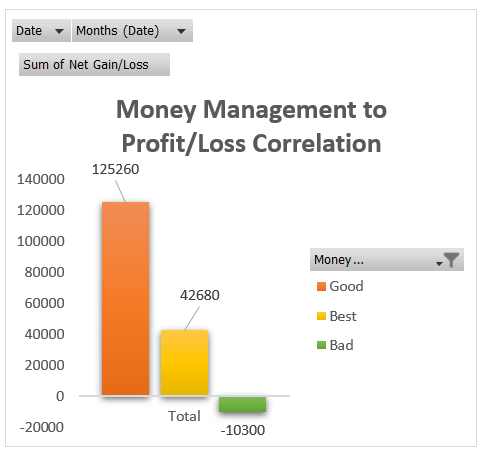
Money Management to PNL Correlation
How was your money management and how did it affect your trade? Hmm, let’s analyse!
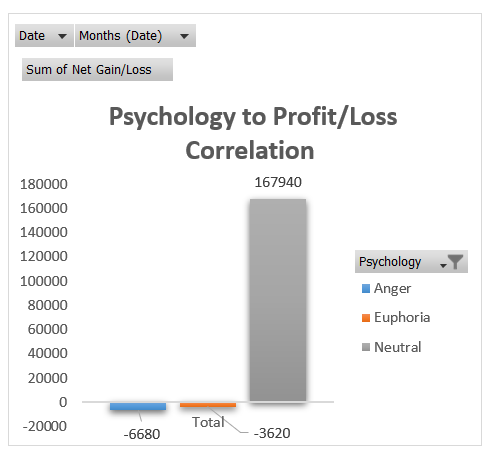
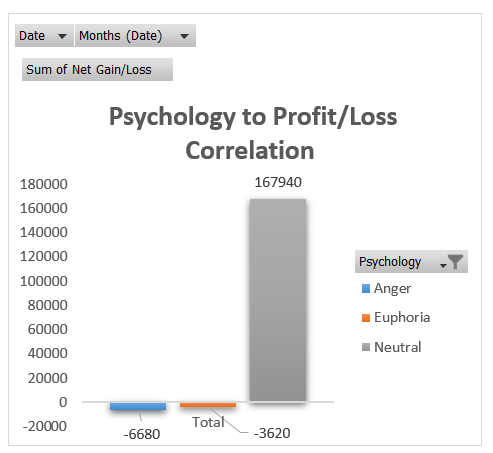
Psychology to PNL Correlation
They say psychology matters. Well, it does. Let’s dive in to this to understand it better.
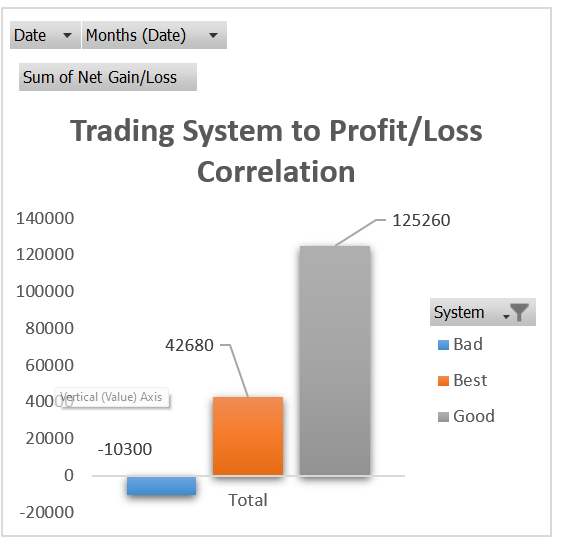
Trading System to PNL Summary
Do you have a trading system in place? Or do you randomly enter and exit trades? Well, let’s build one if you don’t with the trade tracker and if you already have it then let’s analyse.
This Week and Last Week Graph
Which automatically gets updated for the current and last week so you have a fresh view every time.

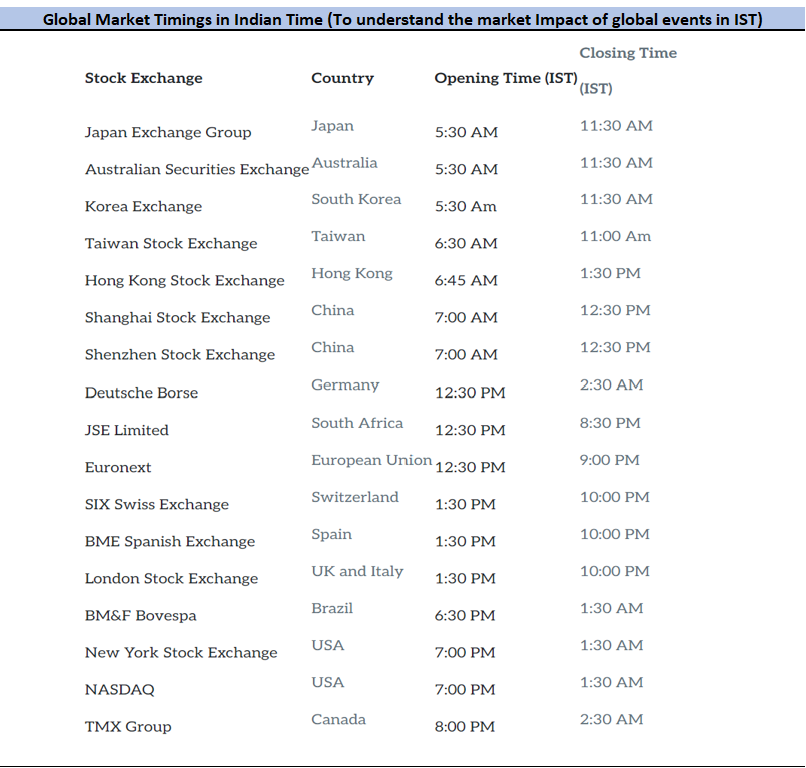
Global Market Timings in Indian Time (IST)
These help in tracking the impact of global events on Indian Markets.

Strike-Price wise Profit/Loss
Which strike price gives you the maximum gains and which ones to avoid? Check this to see what works for you.
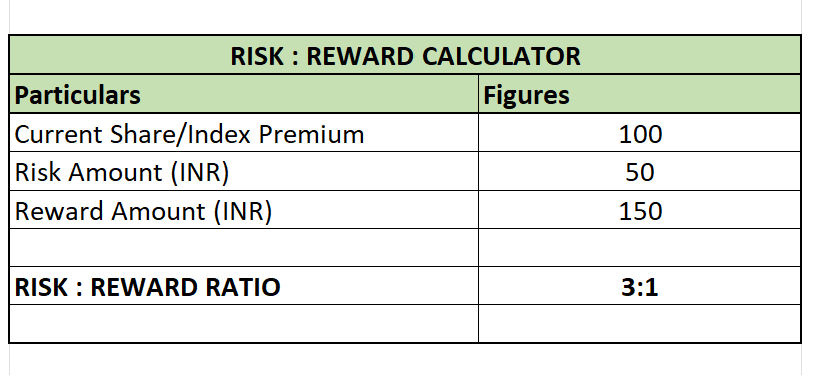
A Risk:Reward Calculator
Built-in to the summary page, that is backing you up for quick calculation before entering a trade.
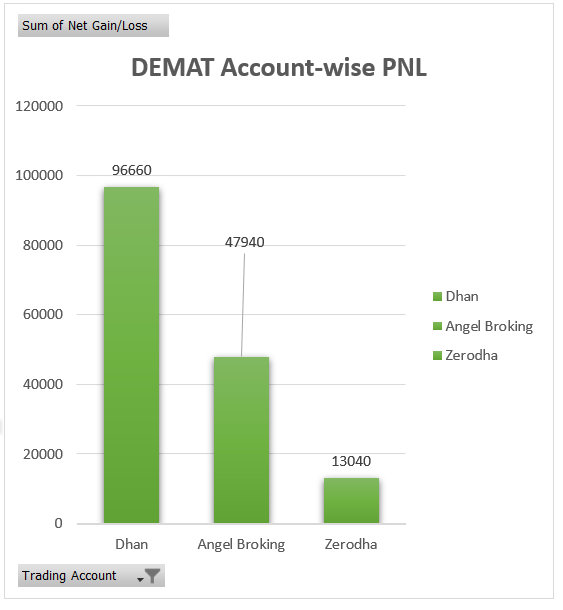
DEMAT Account Wise Profit and Loss Summary
To track everything in One Place. Because what get’s measured, gets done. Right?
Tradelog
This is what you fill, and the visuals are all auto generated. So you can focus on trading and we do the rest.

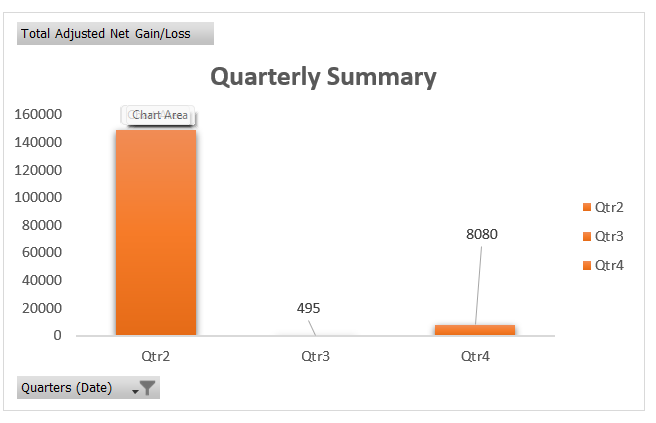
Quarterly Profit/Loss
Zoom out and see your performance every few months. See what’s working, what’s not. Simple!
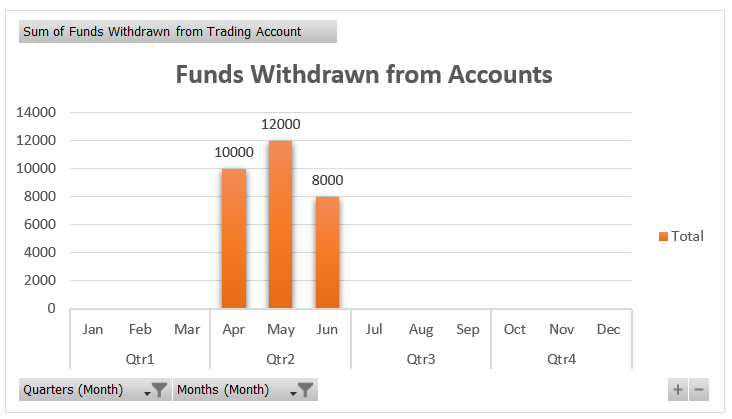
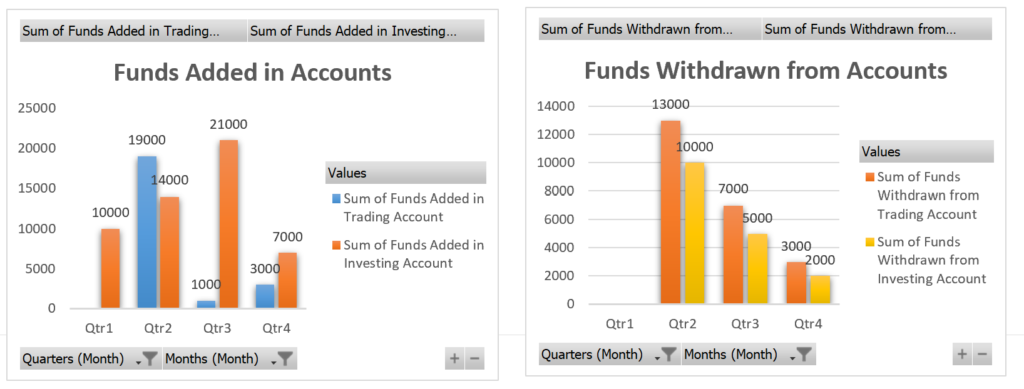
Funds added and Funds Withdrawn Summary
The most important thing is to withdraw funds from your trading account on a timely basis. What’s the point of trading when you can’t enjoy the profits. Right? Let’s cash out some of the profits and enjoy life too. This summary will let you understand the amount you keep putting in and encashing out to know exactly if you’re giving to the markets or taking from it.
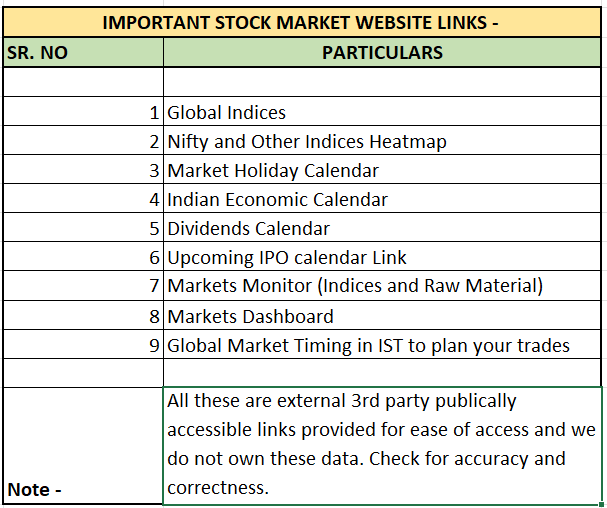
Various Calendar Links in One Place
Note – These are third party unaffiliated links to view Stock market holidays, economic events, dividends calendar, etc. Start your morning with clarity!
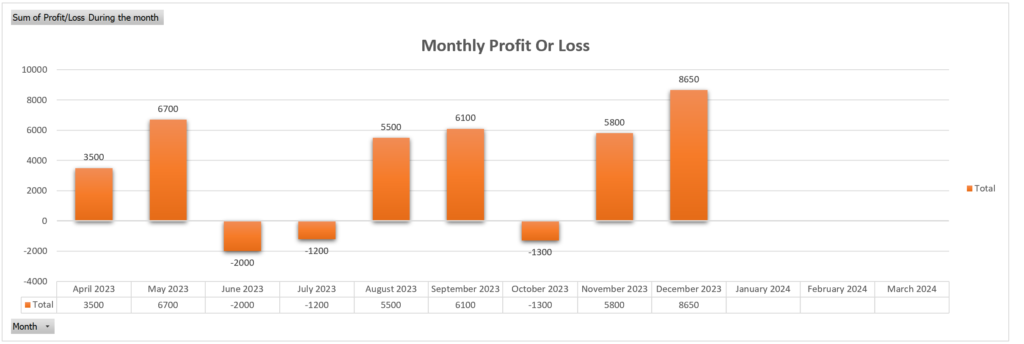
Monthly PNL Summary
Here’s Monthly summary in bar chart form for a more detailed view.
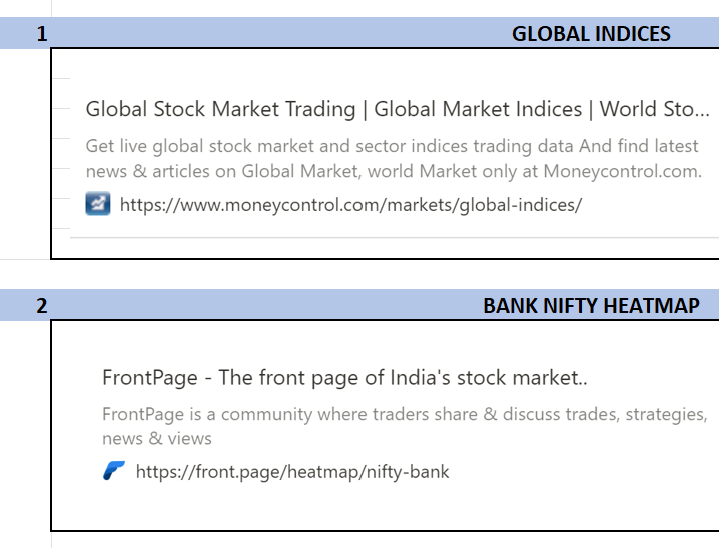
Links to Global Indices and Heat-maps
Note – These are third party unaffiliated links to view global market and heatmaps of various Indices to start your morning with more clarity. Given for ease of reference only.
Calls and Puts Summary
Do you make profits when you trade in calls? or is your style suited for the bear market? Go check it out.

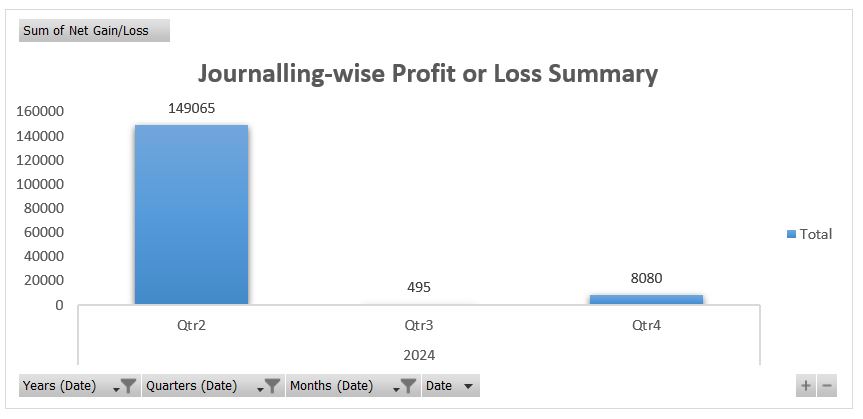
Journaling wise PNL Summary
Do you journal a lot? or you hate journaling? Well, either way we must say if you have your mistakes analysed it does help in avoiding it in the future. Better to know if it was Bull market that favored or was it really because of your system?
Snapshot of the day
A summary showing the gains and losses individually, per trade. So you can review in a jiffy and decide what went right and what went wrong.

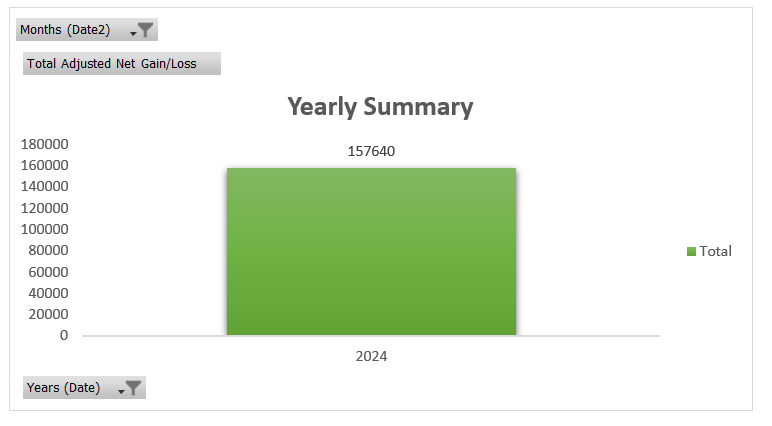
Yearly Summary
There comes a time to reflect on things we did right and the things we did wrong. This year in review will help you see just that.
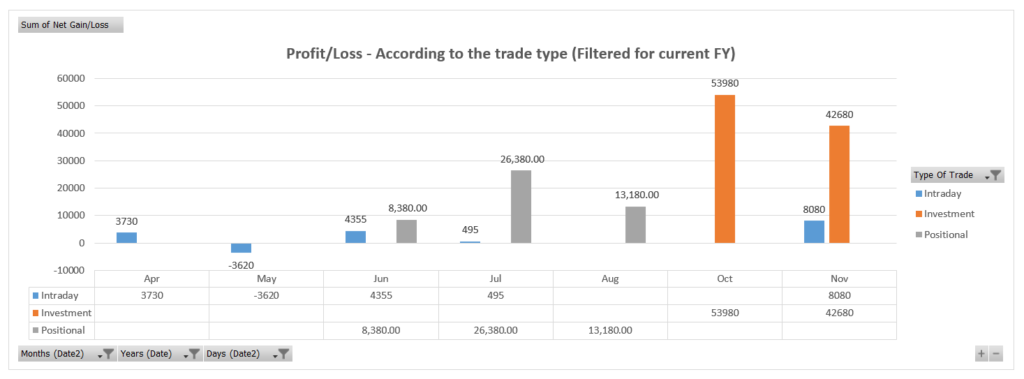
PNL Summary as per the type of trade
Review the profit or loss for your intraday trading, Swing trading and Investments separately so that you can get a better understanding of the gains/losses with TIME taken to achieve the same!

Your PNL and brokerage Charges summary
Review the profit or loss and your charges side to side in order to get a better view of the cost you pay and the NET return you generate.
Note – All the figures mentioned are for reference purpose only. Also, the sample details of brokers, profitability/loss provided is purely for example purpose, hence not to be considered as otherwise. This is not a financial advice or parameter in any sort. Kindly consult your financial advisor before trading/Investing.
If you cannot measure it, you cannot improve it!
Frequently Asked Questions (FAQs) :
Our trading journal is a comprehensive DIY Excel file that allows you to track and analyze your trades effectively. It includes dynamic features for easy data entry, performance analysis, risk management tools, and more.
Once you complete your purchase, you will receive an email within 24 hours containing a download link for the Excel file. Make sure to check your spam or junk folder if you don’t see it in your inbox. Or you’ll receive the file download link upon payment, depending on the checkout option you choose.
Absolutely! Our trading journal is designed for traders of all levels, including beginners. The user-friendly interface and tutorial dashboard with all details make it easy to start tracking and analyzing your trades effectively.
There is no separate tutorial, instead we have created a DASHBOARD page in the template where all the details are provided to you in an easy to understand manner, to get things started.
Yes, the trading journal is customizable. You can tailor it to your specific needs and preferences.
No, there are no recurring fees or subscriptions. Your one-time purchase grants you access to the trading journal, and you can use it without any additional costs.
Please note that we do not currently have a return policy in place for our products.
The product is an Excel spreadsheet designed to [explain the purpose of the product, e.g., track investments, calculate trading profits, manage finances, etc. This product requires Microsoft Excel or a compatible spreadsheet application such as Google Sheets or OpenOffice.
Analyze patterns in your trades, such as consistent mistakes, successful strategies, or times when you perform best. Use this insight to adjust your approach and minimize mistakes in the future.
Acknowledge the mistake, identify patterns, and take actionable steps to avoid it. For example, if you notice you’re consistently entering trades based on emotions, develop rules or checklists to control impulsive decisions.
Yes, you can use different tabs or columns to track the performance of various strategies. This will help you evaluate which strategies are the most profitable and align best with your trading style.
You should track details such as:
– Date and time of trade
– Stock symbol/asset name
– Entry and exit points
– Position size
– Trade direction (buy/sell)
– Stop-loss and take-profit levels
– Reason for entering the trade
– Result of the trade (profit/loss)
– Emotional state during the trade
– Key learnings or observations
Update your journal immediately after each trade to ensure accuracy and to capture your emotional state and thoughts when they are fresh. This will make it easier to reflect and adjust your trading strategy over time.
For manual updating of data from your broker statement in the trading journal, begin by locating key details such as the entry and exit dates, asset names or symbols, entry and exit prices, and position sizes from your broker statement. Manually enter these into the respective columns in the Excel template. Be mindful to input the trade type (e.g., long or short) and any fees or commissions associated with each trade. Additionally, to ensure accuracy in your trading records, verify details like stop-loss levels, target prices, and final profit or loss values by cross-referencing with the broker statement. The journal calculates performance metrics, such as risk-reward ratios or win/loss rate, check that these fields are updated automatically after each entry; if not, refresh as necessary. This manual process may take some time, but it ensures that your trading journal aligns closely with your broker’s records for a clear picture of your trading activity.
The more details you enter, the better visualisation you get. If you feel the details are too much, then enter the specific data that you need to visualize. We recommend to enter all the details as entered in demo data. At first, it might seem a bit of work, but when the chart starts to populate that’s when you see the magic happen and we know it’ll be all worth it. Happy Journaling!

